


Ottawa's Over-Heated Housing Market Is Starting To Become Normal
Tuesday, Jul 13, 2021
The strong Ottawa real estate market started to have a reality check in June with the reduced residential resale and condo sales compared to May this year, increased inventory creating more housing choices for buyers and less upward pressure on housing prices.
Here are the indicators that signal the market's start to normalcy:
Residential Resale Prices Slightly Reduced
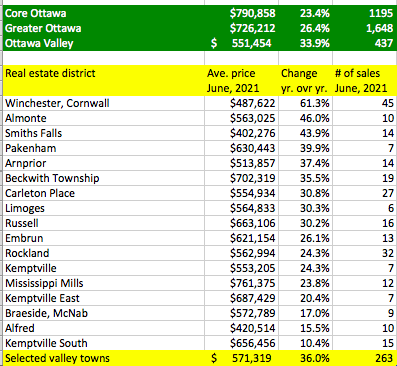
- Ottawa's residential resale prices averaged $726,000 in June this year, which is a 2% decrease from May 2021 and a 4% decrease from the highest price increase peak of nearly $759,000 in March 2020, according to the Ottawa Real Estate Board.
New Housing Inventory Continued To Grow
- New residential resale and condo listings increased significantly by 34.4% with 4,115 listings available in the market compared to 3,062 new listings that existed in June 2020. This trend shows the sellers are feeling more comfortable with the confidence of listing their homes on the market and getting them sold quickly after the significant reduction in new COVID-19 cases and hospitalizations, along with the reopening of the Ottawa economy, particularly in the service sector.
Slight Increase in Sales In Residential Resale Market
- 1,647 residential resale properties were sold, an increase of 2.3%, compared to 1,610 properties sold in June 2020.
- Residential resale properties were sold quickly on average from 31 days to 13 days on the market, which is a 58.2% decrease from June 2020.
- Based on the number of properties sold, buyers purchased residential properties in the $500,000 to the over $1,000,000 price range which accounted for 84.6% of the residential resale property sales.
- Based on the number of properties sold, buyers purchased mostly:
- Two-storey properties - average sale price - $757,334 (previously $596,515 in June 2020)
- Bungalows (1-storey) - average sale price - $681,847 (previously $538,205 in June 2020)
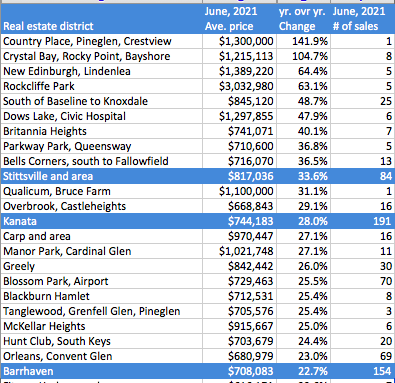
- Most of the residential properties were purchased in:
- Downtown/Central Ottawa - average sale price - $876,018 (previously $738,000 in June 2020)
- Kanata/Nepean/Barrhaven - average sale price - $748,413 (previously $584,679 in June 2020)
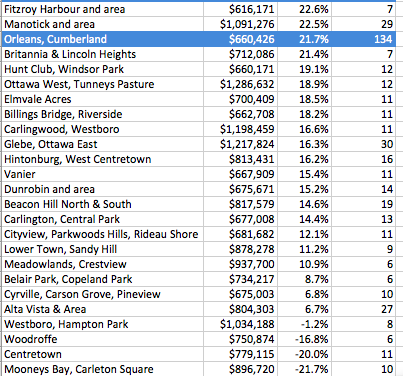
- Orleans - average sale price - $679,788 (previously $565,671 in June 2020)
- Casselman/Rockland/Hawkesbury - average sale price - $535,721 (previously $410,191 in June 2020)
Slight Sale Increases In Condo Resale Market
- 484 units were sold compared to 428 units sold in the same month in 2020, a 13.1% increase.
- Condo units did not sell quickly compared to residential properties. They were sold on average from 24 days to 17 days on the market, which is a 26.6% decrease from the same month in 2020.
- Based on the number of units sold, most buyers purchased condo units priced in the $350,000 to under the $500,000 price range, accounting for 57.4% of the condo market.
- Based on the number of units sold, the most sold condo units were:
- Two-storey units - average sale price - $411,579 (previously $340,446 in June 2020)
- One-level units - average sale price - $442,131 (previously $376,076 in June 2020)
- Most of the condos purchased were in:
- Downtown/Central Ottawa - average sale price - $455,380 (previously $396,588 in June 2020)
Reduced Sales in Luxury Home Market
- 197 luxury properties, priced over $1,000,000, were sold compared to May this year where 243 properties were sold, an 18.9% decrease.
Eastern, Southern & Western Rural Districts of Ottawa Gained Significant Increases in Year-To-Date Average Sale Prices
Districts in the eastern, southern, and western rural parts of the city were the top-ranked areas that had significant average sale price increases year-to-date (from June 2020 - June 2021):
- In the east and south, from Cornwall to Winchester, the average sale price gained over 60%.
- In the west, Almonte and Smiths Falls gained average sale price increases exceeding 40% year over year. (See results in the third table below in the far right).
Source: James Bagnall @jamesbagnalll1, July 6, 2021


